
ADMITTED FRESHMEN AT ILLINOIS PUBLIC UNIVERSITIES: WHO ENROLLS WHERE?
ALL ILLINOIS PUBLIC UNIVERSITIES
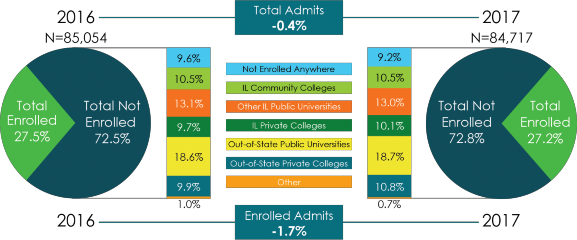
IBHE gathered enrollment information from the Illinois public universities specific to the pipeline of admitted students who ultimately comprised their freshmen classes in both 2016 and 2017. When examining the combined enrollment and matriculation patterns of all admitted students at the 12 Illinois public universities, the year over year changes were all fairly small. There were around 85,000 admitted applicants in both years and there was a slight decline in the number of admitted students enrolling at the given Illinois public university
∙Overall, slightly more than 9% of the admitted students fell into the ‘not enrolled anywhere’ category (9.6% in 2016 and 9.2% in 2017). These were students who were admitted to an Illinois public university but lacked a record of enrollment elsewhere using National Student Clearinghouse student tracker.
∙Roughly a third of admitted students enrolled at other Illinois colleges (33.3% in 2016 and 33.6% in 2017).
∙The proportion of admitted students enrolling at Illinois community colleges (10.5% in 2016 and 10.5% in 2017) and other Illinois public universities (13.1% in 2016 and 13.0% in 2017) were fairly stable year over year; and there was a slight increase in the proportion enrolling at Illinois private colleges (9.7% in 2017 and 10.1% in 2017).
∙Close to 30% of the students admitted to Illinois public universities enrolled outside the state, with a slightly higher proportion enrolling outside the state in 2017 (28.5%) than in 2016 (29.5%).
∙
The results are also presented separately for each public university and emphasize the previous two years of
CHICAGO STATE UNIVERSITY
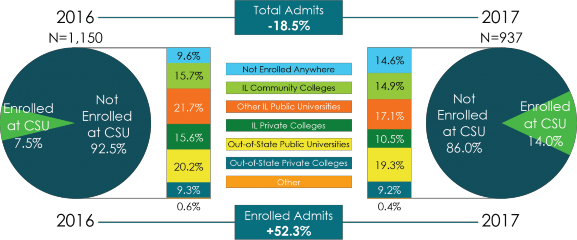
∙Although CSU experienced a robust year over year decline in the number of admitted students from 2016 to 2017
∙Focusing on the students who were admitted to CSU, but did not attend, there were some interesting patterns in examining 2016 and 2017:
o There was a fairly large year over year increase in the proportion (9.6% to 14.6%) and in the number (110 to 137) of CSU admits not enrolling anywhere.
o There were modest declines in the proportion of CSU admits enrolling at other Illinois public universities (21.7% to 17.1%) and at Illinois private colleges (15.6% to 10.5%).
o The
See RESEARCH NOTES for more information on the methods and the data limitations.
EASTERN ILLINOIS UNIVERSITY
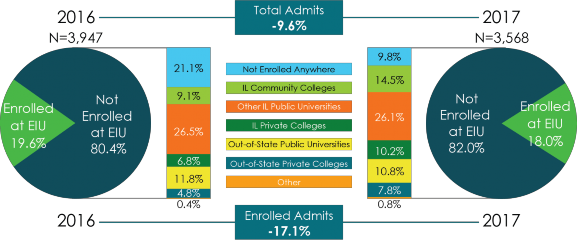
∙ EIU experienced a fairly large decline in the number of admits from 2016 to 2017
∙Among the EIU admits who did not matriculate to EIU:
oHigher proportions enrolled at Illinois community colleges (9.1% to 14.5%) and at private colleges (both
oA substantially lower proportion of the EIU admits fell into the not enrolled anywhere category (21.1% to 9.8%).
oIn both years, other Illinois public universities constituted the sector with the highest proportional enrollment among EIU admits (26.5% in 2016 and 26.1% in 2017).
See RESEARCH NOTES for more information on the methods and the data limitations.
GOVERNORS STATE UNIVERSITY
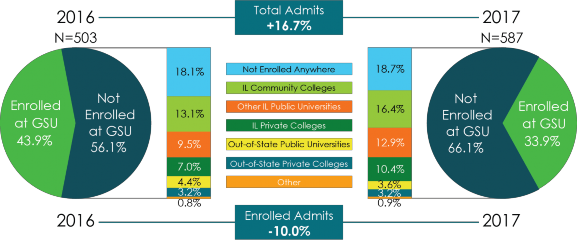
∙Even though the number of admitted applicants at Governors State University increased by +16.7% from 2016 to 2017, the rate of enrollment at GSU among admitted students dropped (from 43.9% to 33.9%), as did the number enrolling (221 to 199 or
∙There were some interesting findings specific to the enrollment patterns of the GSU admits who did not enroll at GSU.
o As the number of admits increased and the rate of enrollment at GSU among admits dropped, the number of GSU admits not matriculating to GSU was significantly larger in 2017 than in 2016 (388 to 282).
o The GSU admits not enrolling anywhere continued to be the largest category in 2017, but enrollment within the
o The
See RESEARCH NOTES for more information on the methods and the data limitations.
ILLINOIS STATE UNIVERSITY
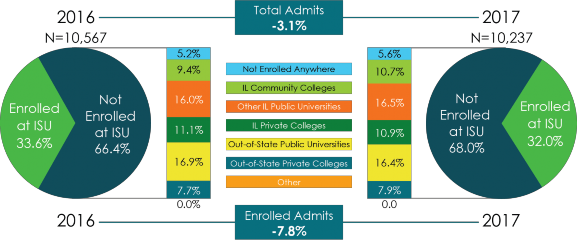
∙ISU experienced a small year over year decline in the number of admitted students (10,567 to 10,237 or
∙Outside of those differences, the enrollment patterns of ISU admits were fairly similar in 2016 and 2017.
∙Across the two years, other Illinois public universities and
See RESEARCH NOTES for more information on the methods and the data limitations.
NORTHEASTERN ILLINOIS UNIVERSITY
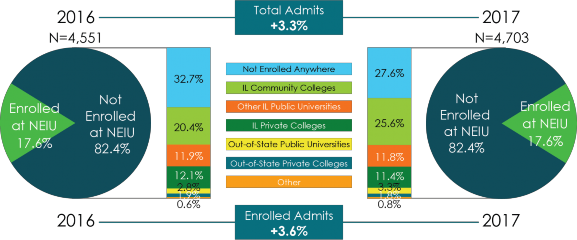
∙NEIU experienced a modest increase in the number of admits (4,551 to 4,703 or +3.3%) from 2016 to 2017 and had the same proportion of admits enrolling at NEIU in both years (17.6%). With a larger pool of admitted students, the number enrolling at NEIU was slightly higher in 2017 (+3.6%).
∙In both years, the ‘not enrolled anywhere’ category constituted the largest group of NEIU admits, followed by Illinois community colleges. Both of these groups were larger than the group of admitted students who enrolled at NEIU.
∙However, in comparing 2017 to 2016, a lower proportion of the NEIU admits fell into the ‘not enrolled anywhere category’ (32.7% to 27.6%) and a higher proportion enrolled at Illinois community colleges (20.4% to 25.6%).
∙The other enrollment patterns among admitted students were fairly similar across the two years.
See RESEARCH NOTES for more information on the methods and the data limitations.
NORTHERN ILLINOIS UNIVERSITY
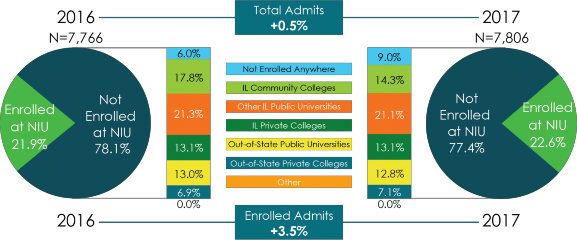
∙NIU had roughly the same number of admitted students in both years (7,766 and 7,806), and NIU experienced a slight increase in the rate of enrollment at NIU among admitted students (21.9% in 2016 and 22.6% in 2017).
∙In comparing 2017 to 2016, a higher proportion of NIU’s admits fell into the ‘not enrolled anywhere category’ while a lower proportion enrolled at Illinois community colleges.
∙In both years, other Illinois public universities constituted the most popular destination outside of NIU (21.3% in 2016 and 21.1% in 2017).
See RESEARCH NOTES for more information on the methods and the data limitations.
SOUTHERN ILLINOIS UNIVERSITY CARBONDALE
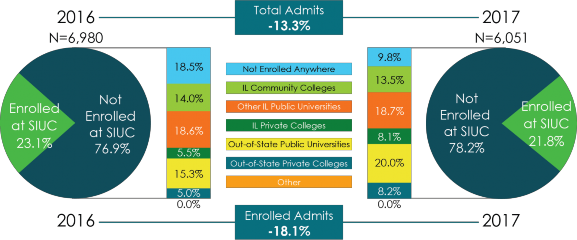
∙SIUC experienced a sharp year over year drop in the number of admitted students (6,980 to 6,051 or
∙A lower proportion of SIUC admits fell into the ‘not enrolled anywhere’ category in comparing 2016 to 2017 (18.5% to 9.8%).
∙Similar proportions of SIUC admits enrolled at other Illinois public universities and Illinois community colleges across the two years.
∙However, notably higher proportions of SIUC admits enrolled at private colleges (both in- state and
See RESEARCH NOTES for more information on the methods and the data limitations.
SOUTHERN ILLINOIS UNIVERSITY EDWARDSVILLE
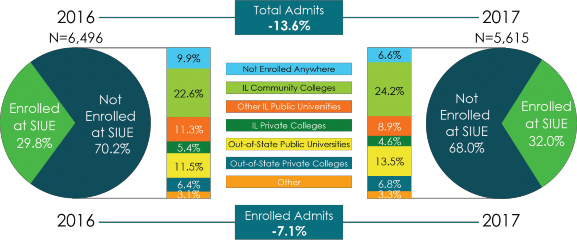
∙SIUE experienced a fairly robust decline in the number of admitted students from 2016 to 2017 (6,496 to 5,615 or
∙A lower proportion of SIUE admits fell into the ‘not enrolled anywhere category’ from 2016 to 2017 (9.9% to 6.6%) and a slightly lower proportion enrolled at other Illinois public universities (11.3% to 8.9%).
∙In both years, Illinois community colleges constituted the most popular destination outside of SIUE (22.6% in 2016 and 24.2% in 2017).
∙Year over year, slightly higher proportions of SIUE admits enrolled at Illinois community colleges (22.6% to 24.2%) and
See RESEARCH NOTES for more information on the methods and the data limitations.
UNIVERSITY OF ILLINOIS AT CHICAGO
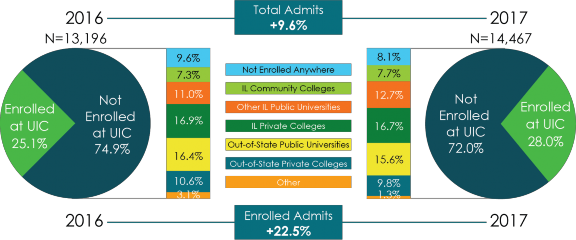
∙UIC experienced significant gains in the number of admitted students (13,196 to 14,467) and in the rate of enrollment among those students (25.1% to 28.0%). In other words, UIC had a substantially higher number of admits in 2017, coupled with a higher yield.
∙The enrollment patterns in the other categories were fairly similar year over year.
∙In both years, the two most popular destinations outside of UIC were private colleges within Illinois (16.9% and 16.7%) and
See RESEARCH NOTES for more information on the methods and the data limitations.
UNIVERSITY OF ILLINOIS AT SPRINGFIELD
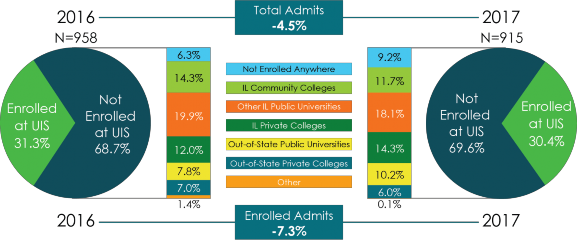
∙UIS experienced a
∙Among the admitted students not enrolling at UIS, a slightly higher proportion fell into the
‘not enrolled anywhere’ category in comparing 2017 to 2016.
∙In both years, other Illinois public universities constituted the most popular destination outside of UIS (19.9% in 2016 and 18.1% in 2017).
See RESEARCH NOTES for more information on the methods and the data limitations.
UNIVERSITY OF ILLINOIS AT
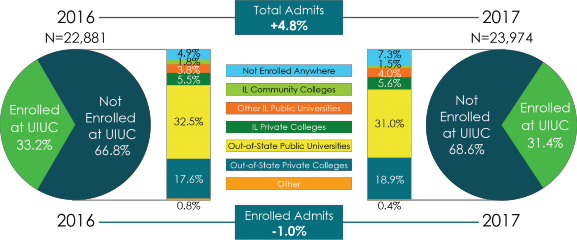
∙From 2016 to 2017, UIUC experienced a modest increase in the number of admitted students (+4.8%) and the number of admitted students enrolling at UIUC stayed relatively flat (7,592 to 7,518).
∙There was an increase in the proportion of admitted students in the ‘not enrolled anywhere category (4.9% to 7.3%).
∙Enrollment at
∙In both years, about half of the UIUC admits enrolled outside the state.
∙Relatedly, only a modest proportion of UIUC admits enrolled at other colleges within Illinois (roughly 11% in both years).
See RESEARCH NOTES for more information on the methods and the data limitations.
WESTERN ILLINOIS UNIVERSITY
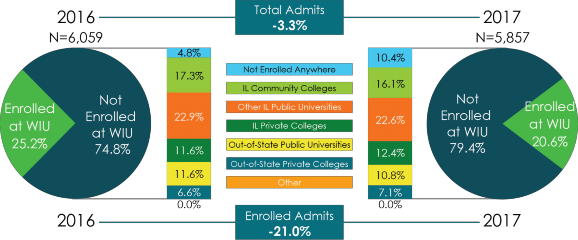
∙WIU experienced a small decline in the number of admitted students (6,059 to 5,857 or - 3.3%), but it was coupled with a robust decline in the number of admitted students who enrolled at WIU (1,527 to 1,206 or
∙WIU also experienced a robust proportional increase in the number of admits not enrolling anywhere (4.8% to 10.4%), while enrollment patterns in the other sectors were fairly similar year over year.
See RESEARCH NOTES for more information on the methods and the data limitations.
RESEARCH NOTES
Earlier this year, IBHE requested and the public universities shared enrollment information on all of their admitted
The public universities were able to determine the proportion of admitted students who did not match to available national enrollment records (from the NSC), which was used as a proxy for ‘not enrolling anywhere.’ Although the NSC provides enrollment coverage for over 98% of students in public and private U.S. institutions, it does not cover enrollment at all colleges in the U.S., nor does it cover colleges outside of the U.S. Therefore, admitted students who ultimately enrolled at colleges that don’t participate in NSC student tracker and international students who are admitted to Illinois public universities but enrolled outside the U.S. would fall into the ‘not enrolled anywhere’ category. Further, in some instances there could be a lack of a match due to students opting out of NSC student tracker or when participating institutions do not have the same identifying information on the same students, so the NSC matching process does not positively identify those students as having matched.
Using that same informational source, the public universities also were able to determine who, among their admitted students, enrolled within one of the following sectors: Illinois community colleges; other Illinois public universities; Illinois private colleges (both
It is important to note that the combined data across the public universities do not necessarily represent unduplicated counts, as the same individual student could gain admission to multiple Illinois public universities.
Illinois Board of Higher Education. (March 2018). Admitted Freshmen at Illinois Public Universities: Who Enrolls Where?(IBHE DataPoints