![]()
Outmigration Context: College Enrollment Patterns of Recent Illinois Public High School Graduates
The following analysis examines the college enrollment patterns of recent Illinois public high school graduates. As shown in Table 1, in 2017 there was a decrease in the number of public high school graduates in the state of Illinois relative to the previous year (-2.5%). Among the slightly smaller high school graduating class of 2017, there was an increase in the number of graduates enrolling in college the fall semester following high school graduation (+2.7%). Therefore, the overall college enrollment rate increased by a robust +3.7 percentage points from 2016 to 2017.
In examining college enrollment by sector, it was evident that the enrollment growth in real numbers in 2017 was mostly within the community college sector (+2,477 from 2016 to 2017). Although the number of recent high school graduates enrolling at baccalaureate-granting institutions was roughly flat from 2015 through 2017 (around 53,000 per year), the smaller pool of graduates in 2017 resulted in a slightly higher rate of enrollment at four-year institutions (39.6% in 2017 relative to 38.5% in 2016 and 38.6% in 2015).
Table 1: Initial College Enrollment* for Recent Illinois Public High School Graduates
|
|
2015 |
2016 |
2017 |
|||
|
Sector** |
Number |
% of Total |
Number |
% of Total |
Number |
% of Total |
|
4-Year |
52,969 |
38.6% |
52,954 |
38.5% |
53,068 |
39.6% |
|
2-Year |
41,658 |
30.3% |
41,812 |
30.4% |
44,289 |
33.0% |
|
Less than 2-Year |
83 |
0.1% |
55 |
<0.1% |
0 |
0 |
|
Total Enrolled |
94,710 |
69.0% |
94,821 |
68.9% |
97,357 |
72.6% |
|
Not Yet Enrolled |
42,580 |
31.0% |
42,763 |
31.1% |
36,803 |
27.4% |
|
Total |
137,290 |
100.0% |
137,584 |
100.0% |
134,160 |
100.0% |
*Initial college enrollment is operationalized as enrollment between July and December in the timeframe immediately following high school graduation.
** See Definitions section.
Out-of-State Enrollment
The short-term trends presented in Figure 1 depict the rate of out-of-state enrollment among: all high school graduates; college-going high school graduates; and high school graduates initially enrolling at four-year institutions. From 2015 to 2017, there was a noticeable increase in the proportion of four-year college-going students enrolling outside the state of Illinois (+3.5 percentage points). In 2017, nearly half (48.4%) of the four-year college-going students enrolled outside the state of Illinois. In addition, slightly more than one-fifth of all Illinois public high school graduates enrolled outside the state.
Figure 1: Percent of Recent Illinois Public High School Graduates Enrolled Out-of-State
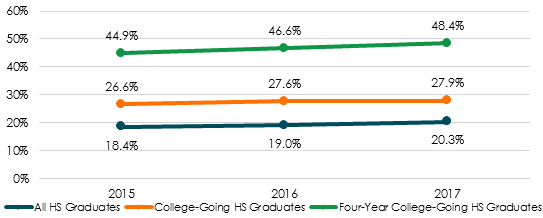
For additional context, in 2002, only 29.3% of the four-year college-going Illinois high school graduates enrolled outside the state (Smalley, Lichtenberger, and Brown, 2010). So in the 15 years that passed, the rate of out-of-state enrollment increased by over 19 percentage points and by nearly two-thirds (65.2%).
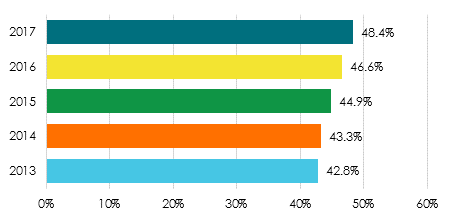
As illustrated in Figure 2, there is some evidence that the rate of out-of-state enrollment accelerated during the Illinois budget impasse. In the three years in which information is available after the beginning of the budget impasse (2015), the average annual increase in the rate of out-of-state enrollment was at least 1.5 percentage points per year. From 2013 to 2014, or the two available years before the budget impasse, the annual increase was only one-half of one percentage point (42.8% to 43.3%).
Figure 2: Rate of Out-of-State Enrollment among Illinois Public High School Graduates Enrolling at Four-Year Colleges from 2013 to 2017 [1]
Enrollment Patterns among Four-Year College-Going Students
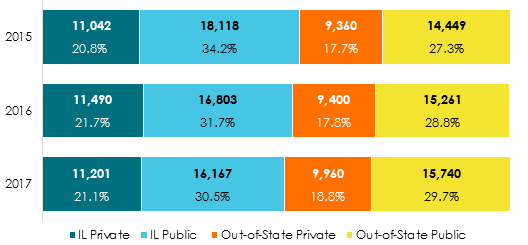
When examining the change in sector-specific enrollment of recent high school graduates, there were a few noticeable and potentially related patterns. As Illustrated in Figure 3, out-of-state enrollment across both sectors, public and private alike, continued to increase from 2015 to 2017. Enrollment at Illinois private colleges and universities was relatively stable from 2015 to 2017 (around 11,000+). At the same time, the proportion and number of recent Illinois high school graduates enrolling at Illinois public universities, as a whole, significantly declined. Therefore, the sharp drop in Illinois-specific enrollment was limited to the Illinois public universities, as more four-year enrollment shifted to out-of-state institutions.
Figure 3: Enrollment Patterns among Illinois Public High School Graduates Enrolling at Four-Year Colleges : Sector and Migration
Top States for Out-of-State Four-Year College Enrollment
As shown in Table 3 , the top six destination states for Illinois high school graduates have remained the same and still account for roughly six out of every ten out-of-state enrollments, but there were some changes in the ordering within the top six. Indiana has surpassed Wisconsin for the second spot up from fourth in 2015, after experiencing an +18.5% increase from 2015 to 2017. Missouri dropped from third to fourth after experiencing a decline of -13.5% in that same timeframe. Although Michigan remained in the fifth position, four-year institutions there experienced a notable increase (+23.3% from 2015) in the number of recent Illinois HS graduates they enrolled.
Kentucky lost its place in the top 10 in 2017, while California moved into the tenth position. In addition, Alabama experienced a +26.9% increase in enrollment of recent Illinois high school graduates and is quickly approaching the perennially seventh placed and geographically closer Minnesota.
Table 3: Top 10 Destination States for Illinois Public High School Graduates Enrolling at Four-Year Colleges
|
2015 |
2016 |
2017 |
||||||
|
State |
# |
Share |
State |
# |
Share |
State |
# |
Share |
|
Iowa |
3,142 |
13.2% |
Iowa |
3,301 |
13.4% |
Iowa |
3,285 |
12.8% |
|
Wisconsin |
3,112 |
13.1% |
Indiana |
3,061 |
12.4% |
Indiana |
3,165 |
12.3% |
|
Missouri |
2,992 |
12.6% |
Wisconsin |
2,997 |
12.2% |
Wisconsin |
3,086 |
12.0% |
|
Indiana |
2,671 |
11.2% |
Missouri |
2,505 |
10.2% |
Missouri |
2,589 |
10.1% |
|
Michigan |
1,554 |
6.5% |
Michigan |
1,667 |
6.8% |
Michigan |
1,916 |
7.5% |
|
Ohio |
1,465 |
6.2% |
Ohio |
1,406 |
5.7% |
Ohio |
1,411 |
5.5% |
|
Minnesota |
685 |
2.9% |
Minnesota |
700 |
2.8% |
Minnesota |
746 |
2.9% |
|
Kentucky |
644 |
2.7% |
Alabama |
682 |
2.8% |
Alabama |
726 |
2.8% |
|
Alabama |
572 |
2.4% |
Kentucky |
649 |
2.6% |
Florida |
674 |
2.6% |
|
Florida |
564 |
2.4% |
Florida |
645 |
2.6% |
California |
618 |
2.4% |
Table 4 lists the top states for growth in enrollment of recent four-year college-going Illinois high school graduates from 2015 to 2017. As shown in Table 4, Washington DC experienced the greatest proportional increase in the enrollment of recent Illinois high school graduates from 2015 to 2017, followed by Utah (+50.5%), and Georgia (+44.9%). Indiana experienced the largest real number increase in recent Illinois high school graduates enrolled (+494), followed by Michigan (+362), and Alabama (+154).
Table 4: Top Ten States for Growth in Illinois Public High School Graduates Enrolling at Four-Year Colleges (2015 to 2017)
|
Percent Increase* |
Number Increase |
||
|
Washington, D.C. |
77.5% |
Indiana |
494 |
|
Utah |
50.5% |
Michigan |
362 |
|
Georgia |
44.9% |
Alabama |
154 |
|
Nebraska |
35.9% |
Iowa |
143 |
|
California |
28.2% |
California |
136 |
|
Alabama |
26.9% |
Florida |
110 |
|
Pennsylvania |
23.6% |
Washington, D.C. |
107 |
|
Mississippi |
23.3% |
Georgia |
102 |
|
Kansas |
23.2% |
New York |
101 |
|
New York |
21.3% |
Colorado |
98 |
*Only includes states that enrolled 100 or more Illinois HS Graduates from 2017
Definitions
(Adapted from the Integrated Postsecondary Educational System)
Four-Year sector : includes postsecondary institutions that offer programs of at least four years duration or offer programs at or above the baccalaureate level.
Two-Year sector : includes postsecondary institutions that offer programs of at least two but less than four years duration.
Less than Two-Year sector: includes postsecondary institutions that offer programs of less than 2-years duration below the baccalaureate level.
Not Yet Enrolled: recent Illinois high school graduates who had not yet enrolled in college during the fall semester immediately following high school graduation.
The initial college enrollment measure differs from what ISBE provides on their School Report Card, which includes enrollment within 12 months and 16 months of high school graduation. Over the past three years, the 12-month enrollment rates were between 68% and 75% and the 16-month enrollment rates were between 71% and 76% (ISBE, 2019).
Illinois State Board of Education. (2019). Illinois School Report Card 2017-2018: Postsecondary Enrollment. Springfield, IL. Retrieved from: http://www.illinoisreportcard.com/State.aspx?source=trends&source2=postsecondaryenrollment&Stateid=IL
Smalley, D. J., Lichtenberger, E. J., & Brown, K. S. (2010). A Longitudinal Study of the Illinois High School Class of 2002: A Six-Year Analysis of Postsecondary Enrollment and Completion . Policy Research: IERC 2010-3. Illinois Education Research Council .
Acknowledgements
The aggregate data used to develop the figures and tables were from the Illinois State Board of Education (ISBE). IBHE would like to thank ISBE for the information.
[1] The 2013 and 2014 information is sourced from: Illinois Board of Higher Education. (January 2017). Outmigration Context: College Enrollment Patterns of Recent Illinois High School Graduates (IBHE DataPoints 2017-1). Springfield, IL. http://www.ibhe.org/pdf/outmigrationcontext2.pdf